Plot - C API
Legend Placement
-
elem_plot¶ A plot is an object that is used to group and display one or more graphical elements. The elements that belong to a plot will share the same coordinates space, we will refer to this latter as the model coordinates space.
The plot works by displaying on the screen a region of the model coordinates space. When in
elem_plot_auto_limitsthe size of the region will be automatically adjusted to accommodate all the objects contained in the plot. Otherwise the size of the region should be explicitly given using the Plot’s methodelem_plot_set_limits().When shown on the screen the plot will show all the objects it contains using for each of them a combination of stroking and filling. The plot will also display the X and Y axis with units and labels if the option
elem_plot_show_unitsis used.The elements that belongs to a plot are organized in incremental layers of visualization that contains one or more graphical elements. Layers and be added or removed from a plot in an incremental fashion.
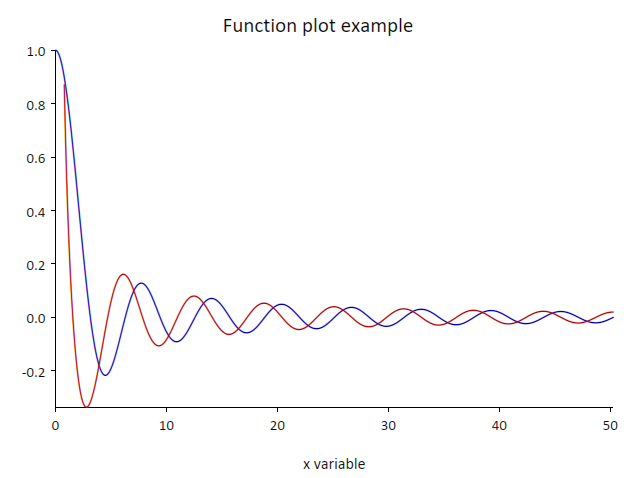
Examples of a plot that contains two Path objects, drawn with different colors.
-
void
elem_plot_set_clip_mode(elem_plot *plot, bool flag)¶ Set the clip mode. If true all the pixel drawn for the graphics elements are clipped in the plotting area.
-
void
elem_plot_set_limits(elem_plot *plot, float x0, float y0, float x1, float y1)¶ Explicitly set the plotting limits, along the two axis. Attention if the plot is in auto limits the limits will be changed when adding new objects.
-
void
elem_plot_set_label_angle(elem_plot *plot, int axis, float angle)¶ Set the angle in radians for the labels of the X axis.
-
void
elem_plot_enable_label_format(elem_plot *plot, int axis, const char *fmt)¶ Set the format to be used to write the label for the given axis. Follow the same format of the printf function but accepts only specifiers for integer and floating point numbers.
-
void
elem_plot_commit_pending_draw(elem_plot *plot_object)¶ Mark all pending changes as done and they are added to the plot elements. Should not be used as plots includes now a mechanism to perform this operation automatically.
-
void
elem_plot_add(elem_plot *plot, elem_object *obj, elem_color stroke_color, float stroke_width, elem_color fill_color, int flags)¶ Add a graphical object to the plot by specifying the stroke color, line’s width and fill color.
-
bool
elem_plot_pop_layer(elem_plot *plot)¶ Discard the current layer with all its content. The previous layer will become the current one. If the plot has only one layer the operation has no effect.
-
void
elem_plot_add_legend(canavs_plot *plot, canavs_plot *legend, int legend_location)¶ Add a new plot as a legend in the given location.
-
void
elem_plot_show(elem_plot *plot, unsigned width, unsigned height, unsigned flags)¶ Show the plot on the screen with the given width and height. The flags argument is currently unused and should be set to
elem_window_resize. It works internally by creating and showing on the screen a window. The functionelem_window_wait()can be used to wait until the window is closed.
-
void
elem_plot_wait(elem_plot *plot)¶ If the plot is shown on the screen, using the
elem_plot_show(), it waits until the window is closed.
-
void