Welcome to Elementary Plot Library’s Homepage
Elementary Plot Library is a C/C++ library for high-quality plots with a clean and simple C and C++ interface and provides support for simple animations.
The library can be used create plots and show them on the screen directly from C or C++ code. It works by adding graphical elements in plots and by attaching the plots to windows to show them on the screen. By default each plot automatically handles the scale and show the plotting axis and labels but the behavior of the plot is customizable.
The library use by default the native windows provided by the hosting system. In addition it can be integrated with existing GUI toolkits. Currently only the FOX toolkit is supported.
The library works on Windows, using MinGW and on Linux. It has minimal dependency by requiring only the AGG and freetype2 libraries.
Documentation
The Elementary Plot Library user manual.
Building from source
The source code of the Elementary Plot library is available on github:
Elementary Plot Library on Github
The software can be compiled and installed using the Meson build system.
Before compiling ensure that the required development library are installed on your system. The Elementary Plot library requires:
the AGG library, 2.4 or 2.5
the freetype2 library, any recent version since 2.7 should work
the FOX library, 1.6, optional, only to build the support for FOX integration
On linux or similar systems you may install the development packages provided by the distribution.
As an alternative you may use the lhelper package utility which includes ready-to-go recipes for the required libraries. It works on unix-like system and on Windows using MSYS2.
On Windows we recommend using MSYS2 with the mingw-w64 packages to produce fully native Window executable. In addition the MSYS2 provides recent versions of the GCC and the Clang compiler.
Install instructions
Once the required libraries are installed the library can be compiled with meson:
meson setup build
ninja -C build
ninja -C build install
By default the library will be built as a shared library but it can be changed using the Meson’s ‘default_library’ option:
meson setup -Ddefault_library=static build
A Simple Example
Here an example:
#include <cmath>
#include "elem/elem.h"
using namespace elem;
int main() {
InitializeFonts();
Plot plot;
const double x0 = 0.0001, x1 = 8 * math::Tau();
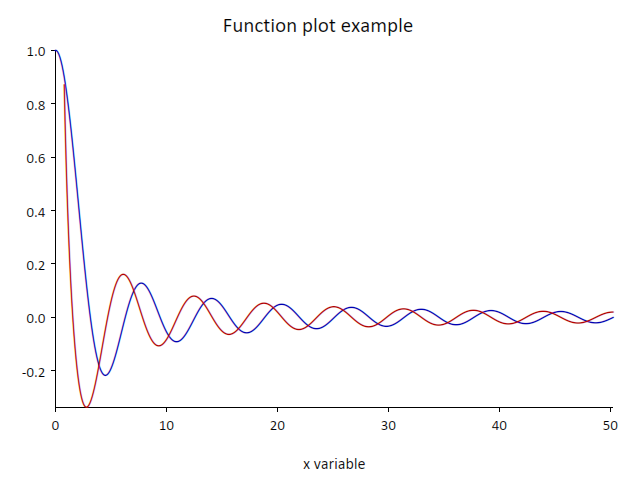
plot.AddStroke(FxLine(x0, x1, [](double x) { return std::sin(x) / x; }), color::Blue, 1.5);
plot.SetTitle("Function plot example");
plot.SetXAxisTitle("x variable");
plot.SetYAxisTitle("y variable");
Window window;
window.Attach(plot, "");
window.Start(640, 480, WindowResize);
plot.AddStroke(FxLine(0.8, x1, [](double x) { return std::cos(x) / x; }), color::Red, 1.5);
window.Wait();
return 0;
}
In the code above we:
initialize the library
create a plot
add a first line, created with FxLine, to the plot using the blue color
set the plot’s title and its axis titles as well
create a window
attach the plot to the window
show the window
add a second line to the plot using the red color. The window will be automatically updated.
wait until the window is closed
Here how the plot looks like:
Simpler version
The same program can be made even more simple like in the code below:
#include <cmath>
#include "elem/elem.h"

using namespace elem;

int main() {
    Plot plot;
    const double x0 = 0.0001, x1 = 8 * math::Tau();
    plot.AddStroke(FxLine(x0, x1, [](double x) { return std::sin(x) / x; }), color::Blue, 1.5);
    plot.SetTitle("Function plot example");
    plot.SetXAxisTitle("x variable");
    plot.SetYAxisTitle("y variable");
    plot.Show(640, 480, WindowResize);
    plot.AddStroke(FxLine(0.8, x1, [](double x) { return std::cos(x) / x; }), color::Red, 1.5);
    plot.Wait();
    return 0;
}
In the simplified version above we have:
removed the InitializeFonts() function
used the Show() and Wait() methods on the plot object, without creating a window.
The InitializeFonts() function can be omitted because it is called automatically when the first window is created.